
See how your buildings use energy. Then act on it.
Monitor electricity, gas, water and other building data in one place. Compare sites, spot unusual use and make informed efficiency decisions.
A tailored walkthrough using the needs of your buildings and portfolio.

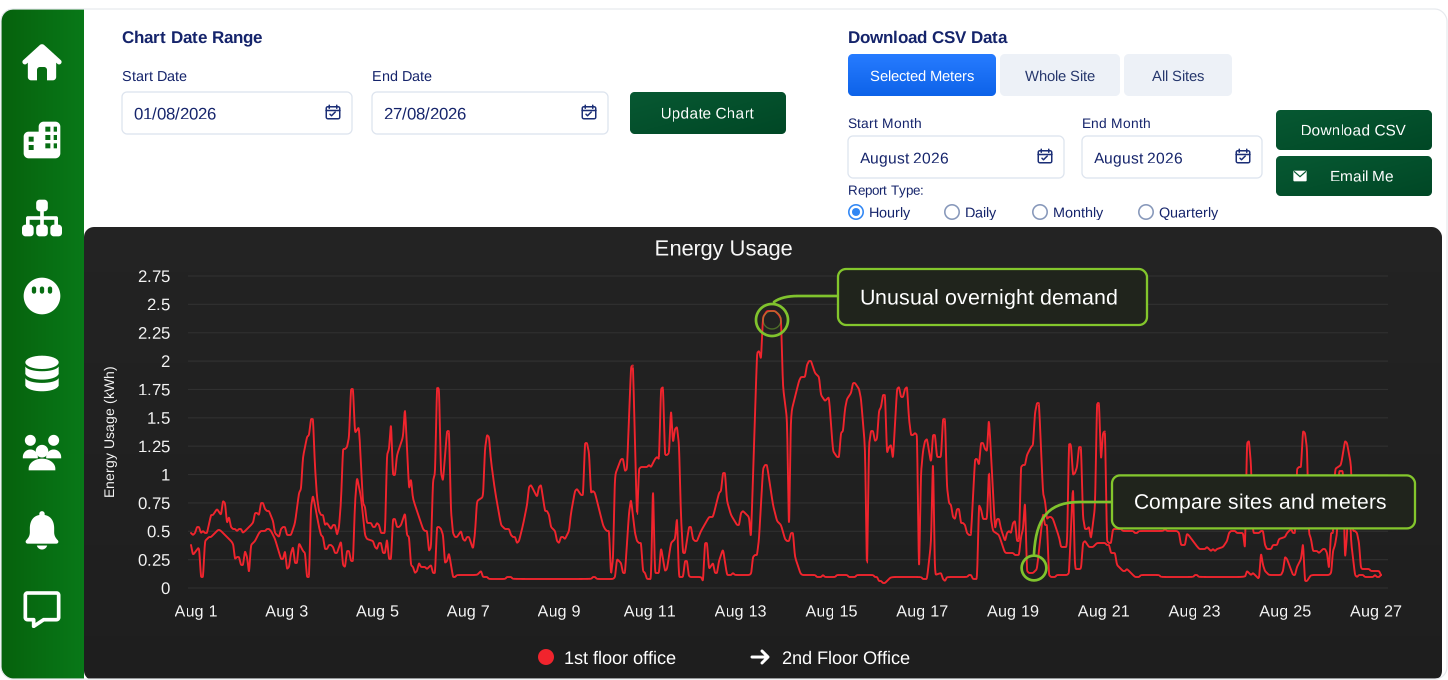
Every site and meter in one clear view
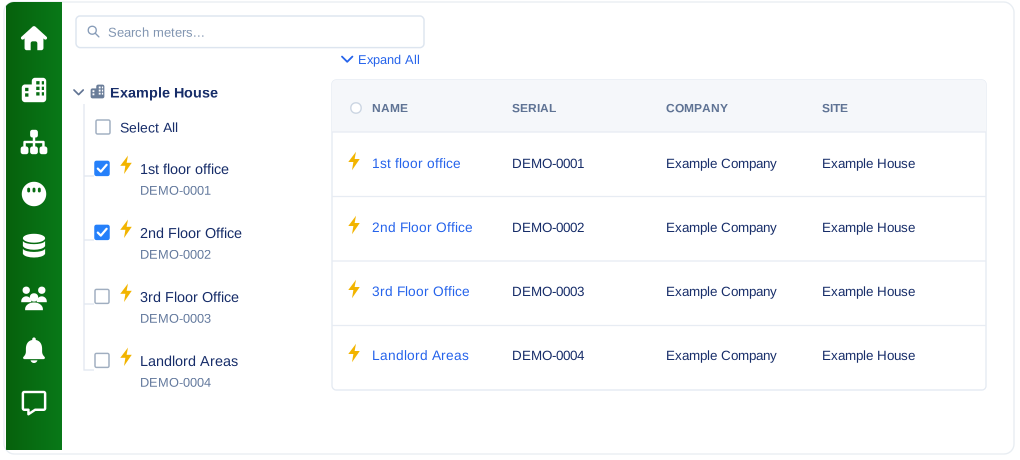
Move from a portfolio-wide picture to an individual meter without losing context.
-
Compare locations
Review buildings side by side and identify where to investigate.
-
Choose the level of detail
Move between whole-site consumption and individual meters.
-
Export the data you need
Download selected-meter or whole-site data for further analysis.
Find the changes that deserve attention
Clear usage patterns make it easier to investigate waste, unexpected demand and changes in building behaviour.
-
What is running overnight?
Spot periods of unexpected demand and investigate what might be causing it.
-
Where has demand changed?
Compare different time periods to understand what has changed and why.
-
Which site or meter needs a closer look?
Quickly identify the sites or meters that warrant further investigation.
One view of the data that shapes your building
Bring utility consumption and other monitored conditions together so teams can understand what is happening in context.
 Electricity
 Gas
 Water
 Temperature
 Occupancy
 Other measuring points
From readings to better-informed decisions
Review trends, investigate unusual use, share data and build the evidence for efficiency improvements.
-
1
Measure
Collect and bring your building data together.
-
2
Understand
Visualise usage, spot issues and share insights.
-
3
Act
Take action, report and build a more efficient future.
Ready to see your building data clearly?
We'll tailor the walkthrough to your sites, meters and reporting needs.
Book a Demo