
Platform features
Bring every building signal into one clearer picture.
Monitor utilities, environmental conditions and operational data across sites and meters. Build the view you need for reporting, investigation and informed decisions.
A tailored walkthrough shaped around your buildings and data.

Measure more than energy
Bring utilities and other monitored conditions together, so teams can understand building performance in context.
 Electricity
 Gas
 Water
 Temperature
 Occupancy
 Other measuring points
Choose the measuring points that matter to each building.
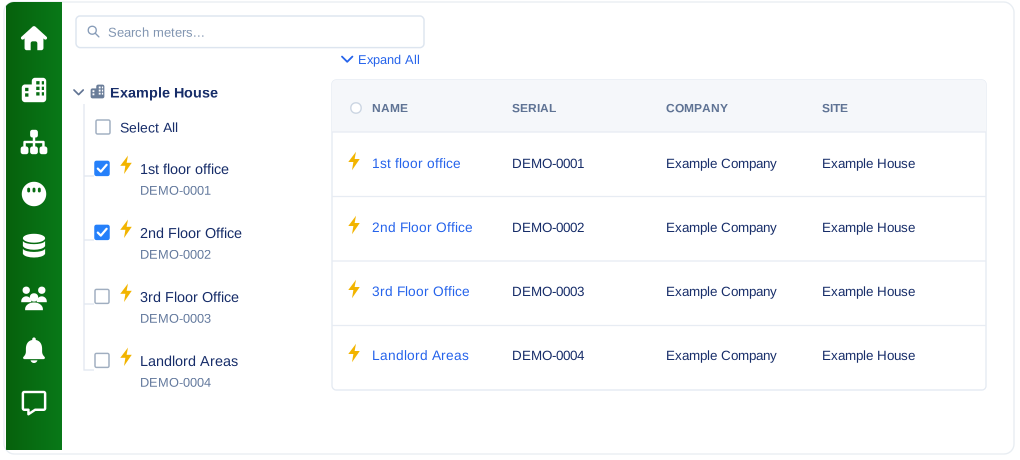
Organise every site and meter
Move from a portfolio-wide picture to an individual measuring point without losing context.
-
Compare locations
Review buildings side by side and identify where to look closer.
-
Group meters by site
Keep electricity, gas, water and other data arranged around the places they belong.
-
Find the detail you need
Search, filter and move from whole-site data to individual meters.
Explore data your way
Choose the period, level of detail and output that supports the question you are asking.
-

Choose the time period
Review hourly, daily, monthly or quarterly data.
-

Compare the right level
Look at selected meters or the whole site.
-

Take the data with you
Download CSV data for further analysis and reporting.
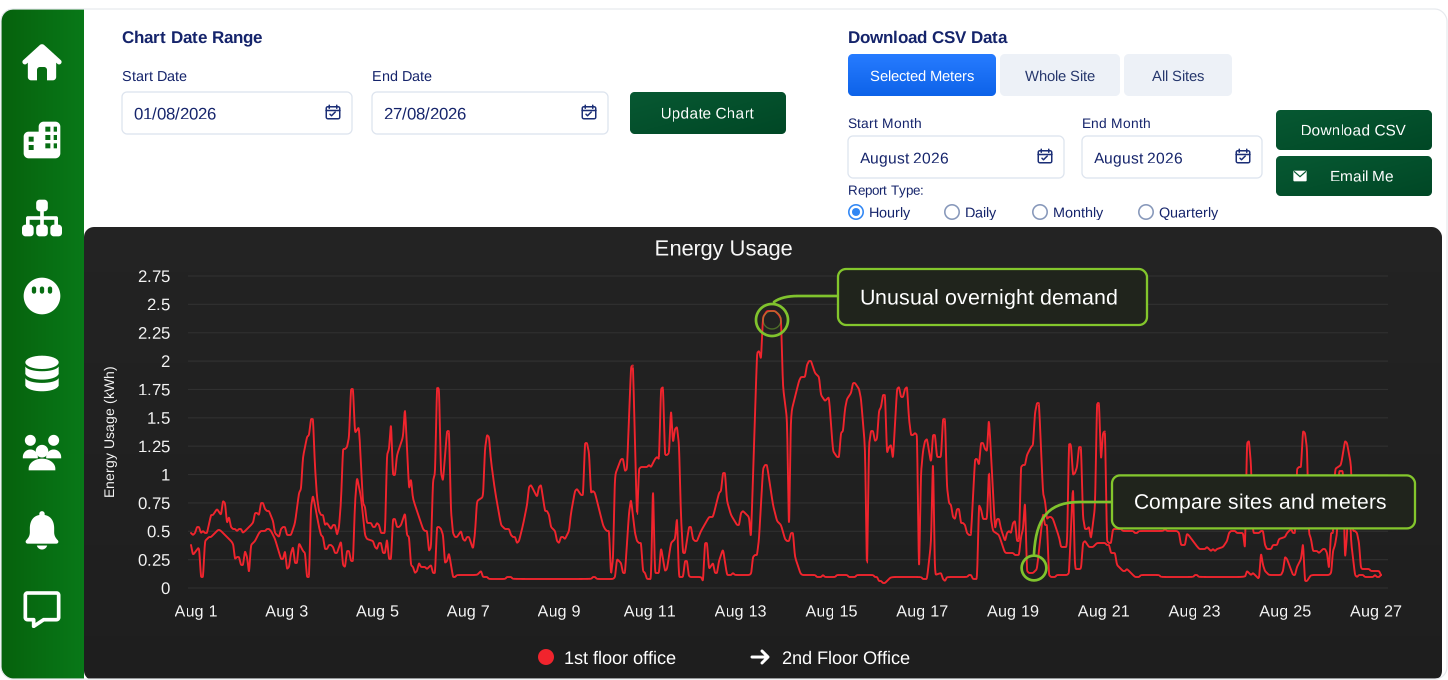
Turn readings into useful actions
A clear workflow helps teams move from building data to better-informed decisions.
-
1
Compare
Review sites, meters and time periods.
-
2

Investigate
Look closer at unusual demand and changes.
-
3
Share
Export data and prepare clear reports.
One platform, connected workflows
Use the same building and meter information across monitoring, reporting and tenant or client billing.
- Monitor
- Understand
- Bill & report
Ready to see every building signal clearly?
We'll tailor the walkthrough to your sites, utilities, other measuring points and reporting needs.
Book a Demo